
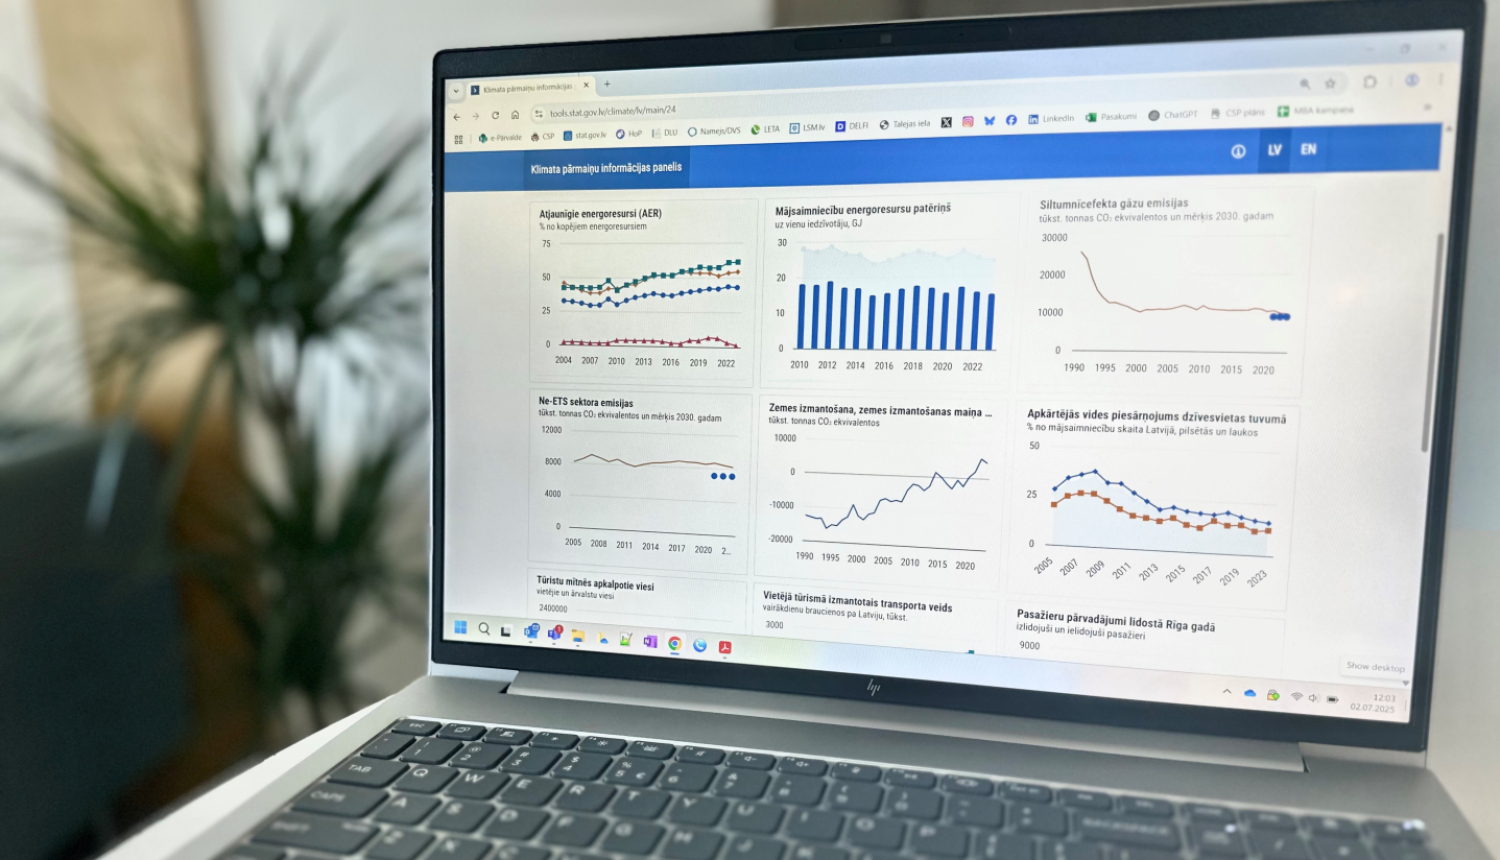
Is Latvia on track to meet its climate goals? With data spread across many different domains, it can be difficult to see the full picture. Central Statistical Bureau (CSB), in cooperation with the Ministry of Climate and Energy, has launched a Climate Change Dashboard that brings together the most essential indicators on a single platform.
‘Climate change is a long-term challenge with wide-reaching consequences for the environment, economies and societies,’ says Raimonds Lapiņš, Director General of the CSB. ‘To effectively evaluate progress towards national climate targets and assess the effectiveness of climate and energy policies, there is a clear need for centralized access to all key indicators. In response to this need, a common Climate Change Dashboard has been developed to serve as a useful instrument for climate policy planning and decision-making in Latvia.’
The new dashboard provides a clear overview of data on greenhouse gas (GHG) emissions and energy consumption, alongside other areas that affect the climate. These include the transport sector, with indicators such as vehicle age and the share of electric vehicles, and the tourism sector, where economic growth must be balanced with the protection of natural and local resources. In addition, CSB is expanding the dashboard to include environmental indicators related to human health – for example, the share of population living near sources of environmental pollution.
Kaspars Melnis, Minister for Climate and Energy, emphasises that: ‘Although views may differ, the world is changing – and one of the most visible signs of climate change is the increasing frequency of unusual weather conditions. Periods of extreme heat or unseasonal cold, prolonged rainfall, flooding, and more frequent severe storms outside their usual seasons are all part of broader shifts. Tracking progress towards climate targets helps us assess what has already been achieved and identify areas for improvement.’
The indicators in the dashboard allow for regular assessment and monitoring of the current situation, helping to ensure that planned activities are being implemented and are delivering the intended results.
‘The dashboard is a dynamic tool which includes indicators already set out in national planning documents and will be expanded to include additional ones developed together with sector experts, thus providing even greater support to policy planners, professionals and researchers. All dashboard indicators meet high quality standards: they are supported by methodology and metadata, and only included if long-term time series can be ensured The CSB sees the dashboard as a shared platform for all Latvian institutions and organisations involved in collecting data on climate change impacts, such as the Latvian Environment, Geology and Meteorology Centre, Centre for Disease Prevention and Control, Rural Support Service, Health Inspectorate, Nature Conservation Agency, State Forest Service, the Silava research institute, Latvian Institute of Aquatic Ecology, Latvian Insurers Association, and others. In addition, CSB is working on more detailed territorial data, which will make the dashboard more useful for municipalities, and by the end of 2026 it will be supplemented with ecosystem accounting data,’ says Sigita Purona-Sida, Director of the Environment Statistics Department.
As the dashboard highlights, the GHG emissions in Latvia have fallen by around 16 million tonnes since 1990, and Latvia is making steady progress towards its 2030 target. The data also show a steady increase in the number of electric vehicles — up by more than 9 000 over the past decade — and a year-on-year rise in the share of renewable energy used for heating and cooling, which reached over 61 % in 2024. These developments reflect a broader shift towards cleaner energy use, lower emissions, and a more sustainable transport system.
The dashboard provides a clear overview of historical data and key climate indicators in Latvian and English, combining statistics from the official statistics portal with administrative data provided by institutions such as the Road Traffic Safety Directorate, Centre for Disease Prevention and Control, and Latvian Environment, Geology and Meteorology Centre. All indicators are produced using harmonised calculation methods and include detailed information on data sources and methodology, ensuring clarity, consistency, and reliability. Users can download data directly and easily share or reuse selected indicators through a shareable link and embed code.
In light of rapid environmental and societal changes, it is essential that the dashboard data remain relevant, up to date, and easy to use. CSB therefore continues to monitor climate change trends and actively explores ways to expand the dashboard with new indicators.